Datgel Fence And Map Tool
Fence and Map Tool
Overview
The Datgel Fence and Map Tool is a collection of 46 gINT reports which provides an extensive range of data presentation options, including dynamically generated scale bars and legends/keys. The Tool is applicable to the AGS RTA database structure and DGD database structure (DGD is the structure used by the Datgel Advanced In Situ, CPT, DGD, Lab & In Situ, and Monitoring Tools).
This Tool is a culmination of years of development and optimisation by Datgel's expert gINT developers, and would take hundreds of hours to develop from scratch.
Webinar - Thursday, 4 June 2020
Exceptional and flexible 2D fence reports in gINT without you writing code with the Datgel Fence and Map Tool gINT Add-In
 | Key FeaturesThere are 5 major components of the Tool:
What's new in Version 3
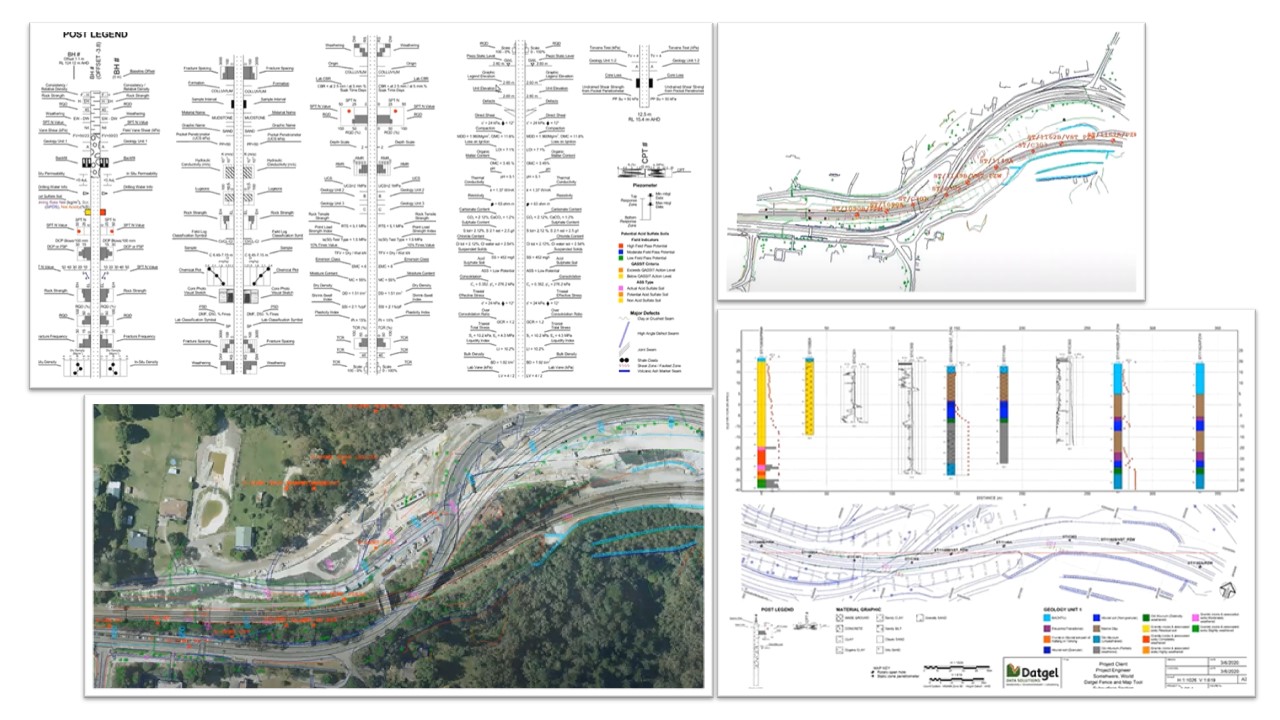
Fence ReportsThe Fence Reports optionally include a site map so you can easily visualise the positions and locations of the fence posts relative to the map. A range of page sizes are available, starting from A4 portrait and landscape, up to A1 landscape, Letter size portrait and landscape and 11x17 portrait and landscape. Point related data, such as soil/rock logging data in the form of graphs, charts, images and text, can be displayed on the left or right sides of the fence post and each type can be offset, by a variable distance, relative to the fence post. The fence reports can plot the following data on your fence posts:
The fence posts can also be configured to display the material graphic, the geology map code colour, geology project unit colour and the origin colour. The colours and the graphics are all configurable to suit your project specific requirements. Fence Post LegendIdentifying and understanding the Fence report becomes much easier with the Fence Legend. The Fence Legend is dynamically defined based on which data items are showing on the fence posts. Map ReportsThe map reports automatically defines a "proper" scale that fits the selected PointIDs in the map data frame. And the user has the ability to override the map area displayed and manually define the scale. Reports sizes from A4 to A1, Letter size and 11x17" are included. Map KeyThe map key and associated library tables allows the user to define the data marker for each point type, and display a dynamically defined map key on map reports and fence reports with a site map. Scale BarA scale bar is automatically generated for site maps and both axes of fence reports. |