Datgel Photo Tool
Photo Tool
The Datgel Photo Tool gINT Add-In makes it quick and easy to link, organise and print core box photos, test pit photos, surface photos, sketches and more.
Example Output
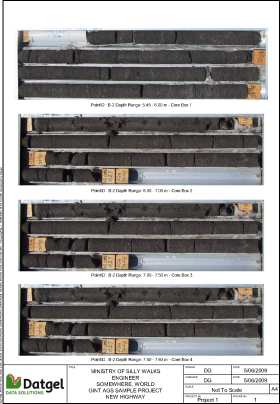
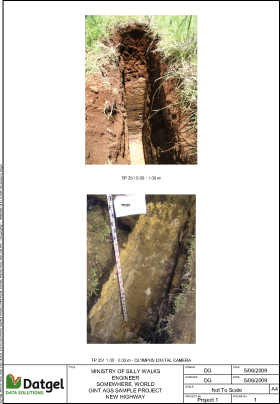
 Example 4 Pictures per Page report |  Example 2 Pictures per Page report |
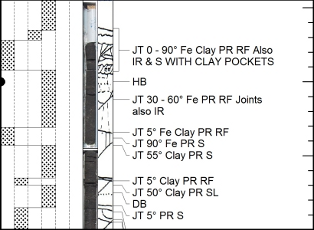
 Detail Recovered Core Defect Sketch | |
How does it work?
- Step 1: You place your jpg files in specifically named folders, and rename them to our naming convention. You'd do something like this anyway.
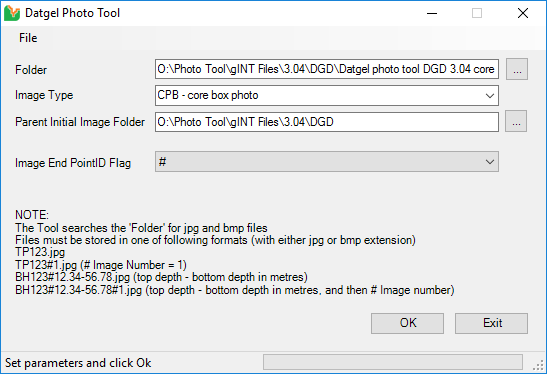
- Step 2: After entering your logging data into gINT, run the Add-In menu to launch the Photo Tool form. Configure 2 or 3 items and click OK. The photos are now linked to your gINT project, but we don't import the photos into the database nor do we store explicit paths. In fact we just store the PointID, and top depth, bottom depth, and image type (also sometimes an image number), and from this we can calculate the image file full path at output time.
- Step 3: Go to output and print off your photo reports, the image dimensions on the page are constrained but not skewed, so you get a neat outcome every time.
The Add-In Form
The Add-In form is launched from within gINT and is used to link images to the project file.

Image types in either *.jpg or *.bmp format that can be selected are:
- Core Box
- Core "sticks" or lengths of recovered core
- Downhole Images
- Field Sketches (e.g. scanned sketches of a test pit face of an exposure)
- General images or sketches
- Images of samples
- Test Pit or exposure images
- Vibrocore Photos
- Sketches of recovered core (e.g. sketches of the defects within the recovered core)
Reports
The tool also includes a range of gINT Reports in A4 and Letter page sizes:
- Log report showing a downhole image by depth
- Log reports showing test pit and core photos on additional pages, great for users that only have gINT Logs
- Graphic Table reports for Core Box photos showing 1, 2 or 4 images per page
- Graphic Table reports for Sample photos showing 1 or 2 images per page
- Graphic Table reports for Test Pit photos showing 1 or 2 images per page
- Graphic Table reports for Vibrocore photos showing 1 or 2 images per page
The Log report has been provided as an example so that it can be copied to an existing gINT report to show the linked downhole images on the existing Log report. The Graphic Table reports are all equipped with a standardised title block, making them instantly useable.
The identification and description information that appears beneath the photos on the Graphic Table reports is fully configurable by the user.
