gINT Professional
gINT SoftwaregINT is the leader in software for Geotechnical and Geoenvironmental data management and reporting with over 7,700 licensees in 68 countries. Datgel is an authorised global reseller of gINT. As of 2026, gINT can only be sold to accounts/companies that hold existing licenses.
| ||
From point solutions to systems customized to your requirements, leverage Datgel's advanced knowledge and experience with gINT:
|
|
gINT Professional
 gINT Professional provides a full suite of customisable reporting and data management tools, everything from borehole logs and cross sections (fence diagrams) to graphs, tables and lab testing. All in an easy to use, automated interface.
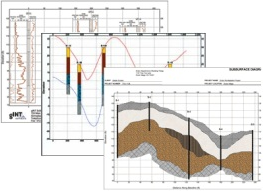
Cross Sections and Profiles
gINT Professional allows you to create cross sections and profiles (fence diagrams) by interpreting between boreholes using gINT's own drawing tools or standard CAD applications.
You can also create 2D or 3D section diagrams.
Powerful data management and reporting
gINT Professional offers a powerful range of capabilities to help automate daily tasks. Because all data is efficiently stored in a completely customisable database, you can easily access, evaluate, and compare whatever data you choose, even for small projects.
gINT comes with a huge symbol library to give you added flexibility. With nearly 1,000 symbols that can be combined to make a near-infinite variety, you'll have everything you need for your own distinctive report generation.
Nine report styles are included:
- Borehole logs
- Fence Diagrams
- Graphs
- Histograms
- Graphical Tables
- Graphical Text Documents
- Text Tables
- Test Documents
- Site Maps
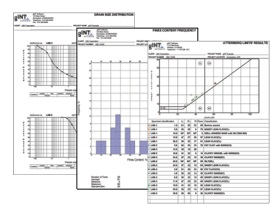 Quality Lab Reports
gINT Logs allows you to perform lab testing data calculations but it is gINT Professional that allows you to display your lab data on specialised lab test reports.
Smart Forms
gINT Professional's "Smart Forms" enable you to simplify your report templates by rolling every contingency into one. If, for example, well construction information is present on one borehole but absent on another, the "smart form" will automatically add or leave out a well data column in the log. Instead of printing a blank column when well data doesn't exist, the content of the rest of the log automatically expands to fill the space. You can therefore avoid creating new templates for every data contingency.
Easy, flexible and simple Import and Export Capabilities
Import from a program, cut and paste into the spreadsheet or use the graphic-input mode to enter your data. Enjoy virtually unlimited import and export capabilities through a wider range of options.
Customisable reporting
Though all gINT programs come with standard templates, gINT Logs and Professional is fully customisable, and you can use it to create an unlimited number of databases and reports of your own. gINT offers many tools to help you with data entry and reporting. For example, you can create your own look-up tables to enhance data accuracy, and you can also create "smart forms" that reshape themselves depending on the presence or absence of data. gINT Professional also offers its own programming toolbox, gINT Rules, that enables users to create and automate routines within gINT.
Automation, Expressions and Calculations
gINT Professional helps make calculating by hand a thing of the past. The program will do calculations for you with very little setup, extracting the numbers you need from your database. Having the program do your calculations for you saves time and money with every usage.
Graphical Input Mode
gINT Professional makes working with your log data even easier. The Graphical Input Mode option enables you to input data on an image of your log while the database records your data in the background. Even the newest user can use it as a visual roadmap to enter and manipulate data directly, without having to know the details of the underlying database structure. Meanwhile, your data remains accessible in the database for future needs.