Output Tool - Examples
Output Tool
Saves hours on moderate sized projects, and weeks on larger projects.
The Datgel Output Tool enables the user to create output configurations of multiple reports in a user friendly interface, save and recall configurations, and print or pdf the reports. It also can generate cross-section fences reports along an alignment.
Output Tool Examples
Reports grouped by PointID
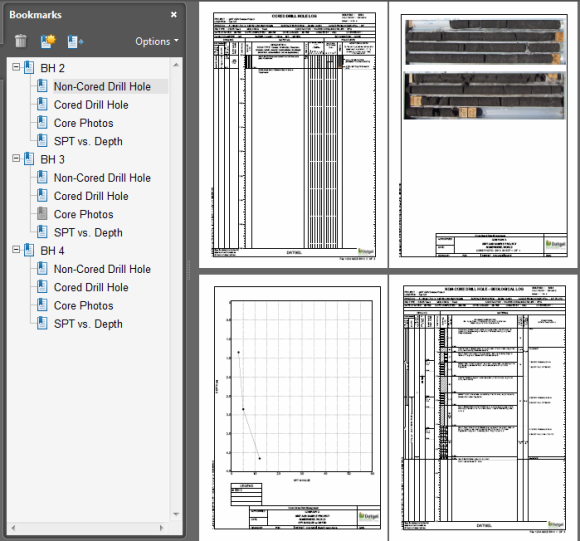
Automatically generate an appendix for your site investigation report. This example shows the batch output of a non-cored log, cored log, core photo report and SPT vs. depth graph grouped by PointID.
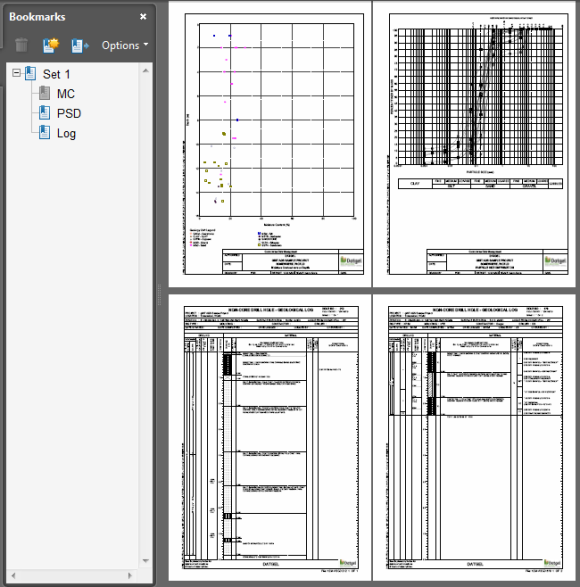
All Reports
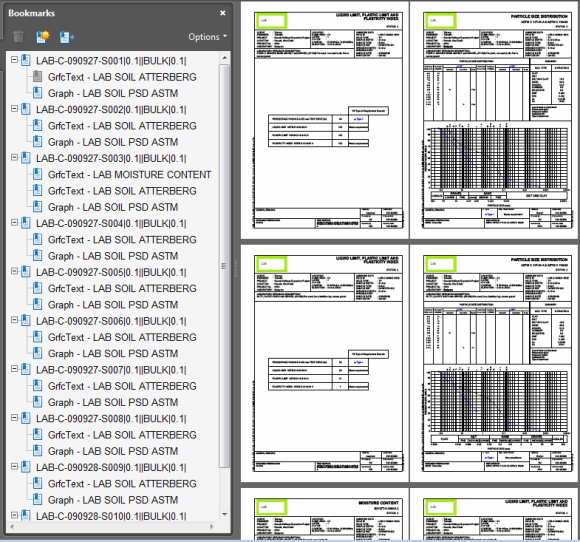
This example exports a PDF of all reports in the Datgel Lab Tool for a PointID grouped by Report.
Composite Graph
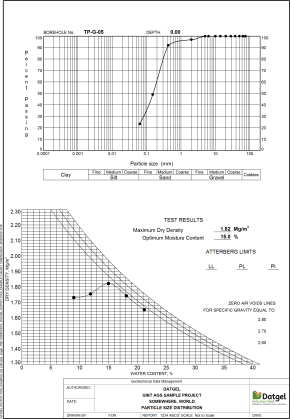
This example outputs the PSD COMPOSITE and the COMPACTION COMPOSITE Graph reports for each PointID to one gINT drawing page/sheet and then exports the page to the specified PDF file.
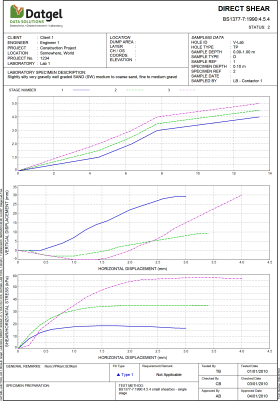
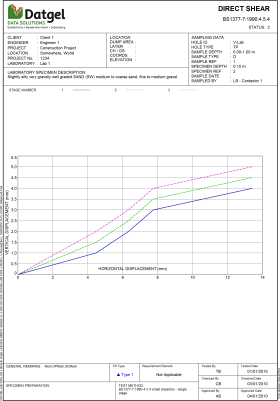
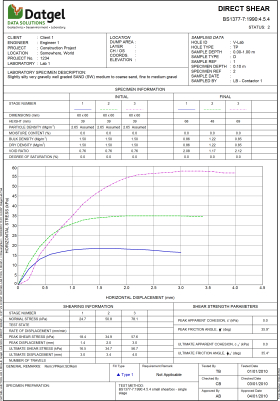
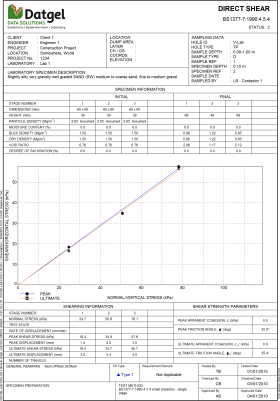
Direct Shear
This example outputs a suite of reports for a direct shear test, including a page with three graph frames.
 |  |
 |  |
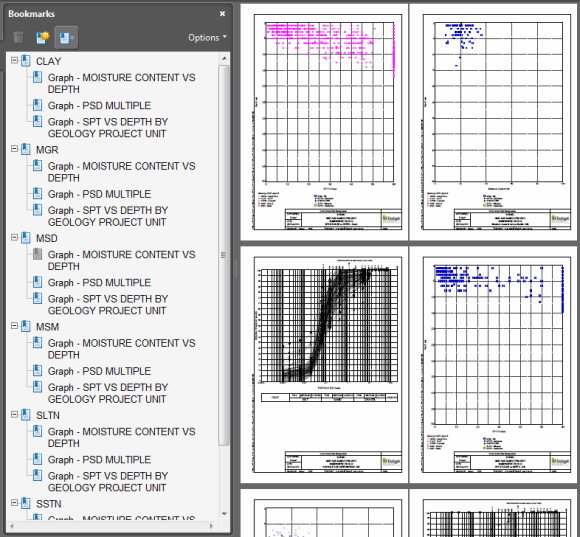
Group By Range Filter
This example shows the batch output of a moisture content vs. depth graph, a PSD graph and a SPT vs. depth graph, grouped by Geological Unit. It uses the Replace User Report Variable functionality to set the Drawn, Approved and Approved Date, and append the Geological Unit Description to the end of the figure title.
Group By Report
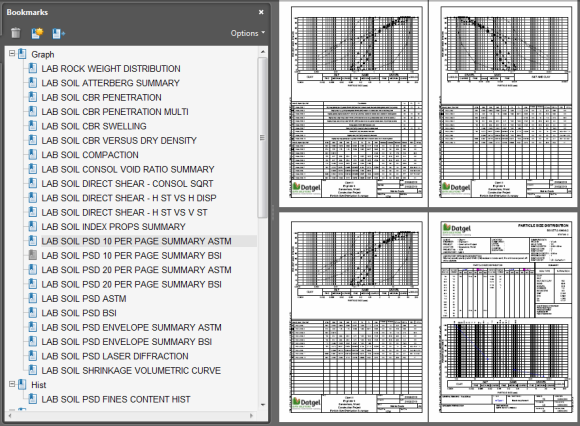
This example shows the batch output of a moisture content graph, a PSD graph and a non-cored log grouped by Report Name.
Group by Sample
This example exports a PDF of lab reports grouped by Key Set. It results in a bookmark for each specimen Key Set with child bookmarks for each lab report sheet.